To 1x NVIDIA H100 GPU, Qwen3.8-27B isn't a model. It's a loop of 902 kernels.
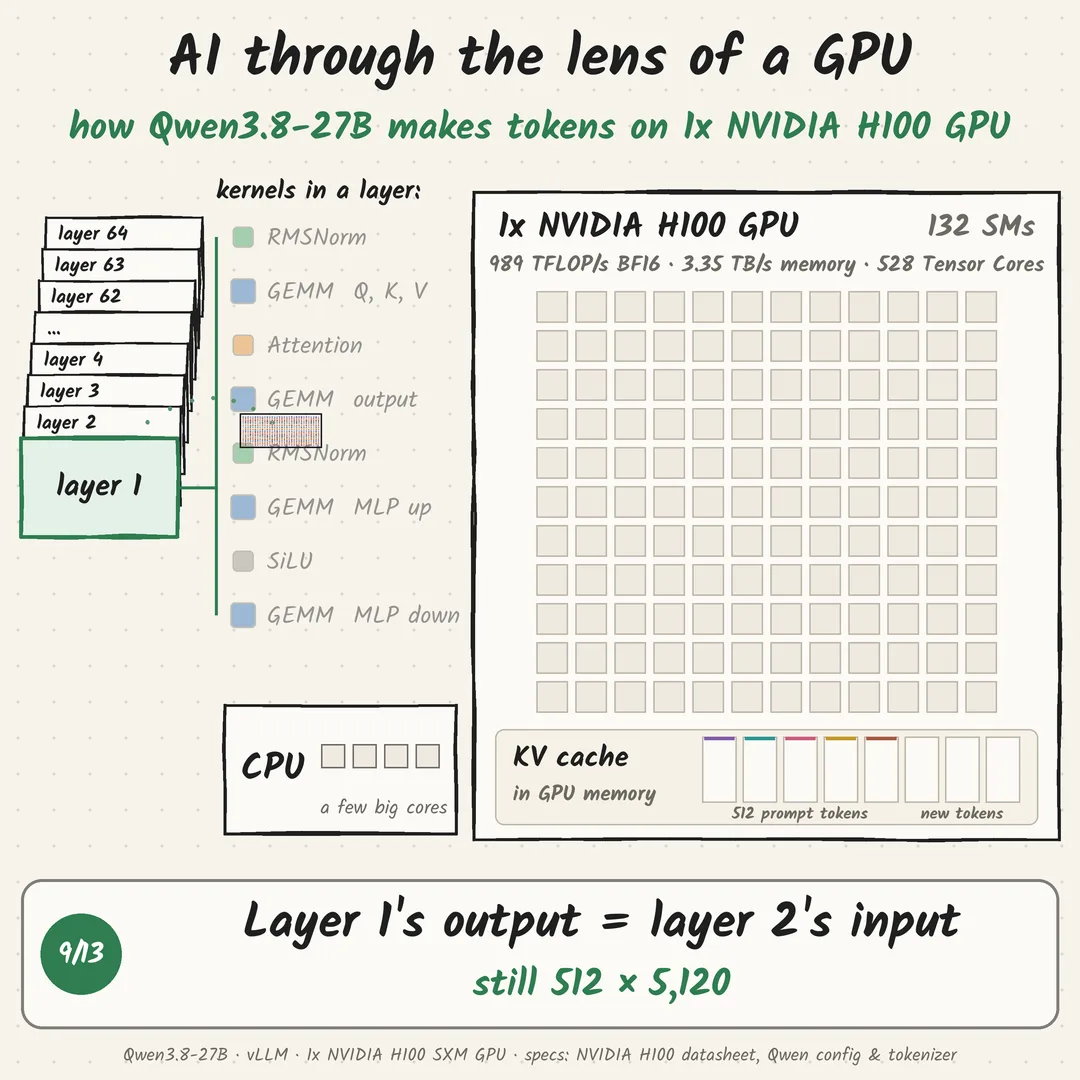
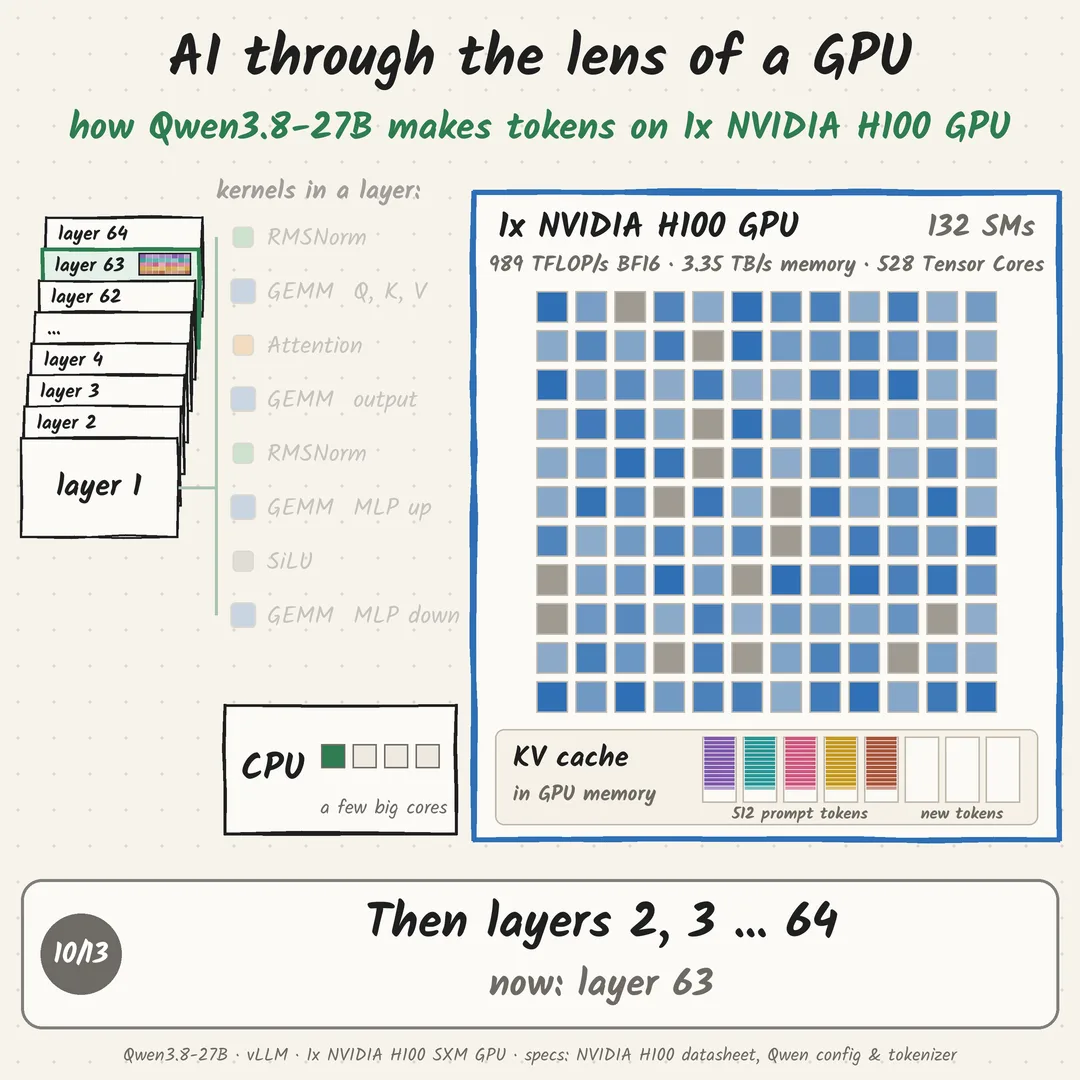
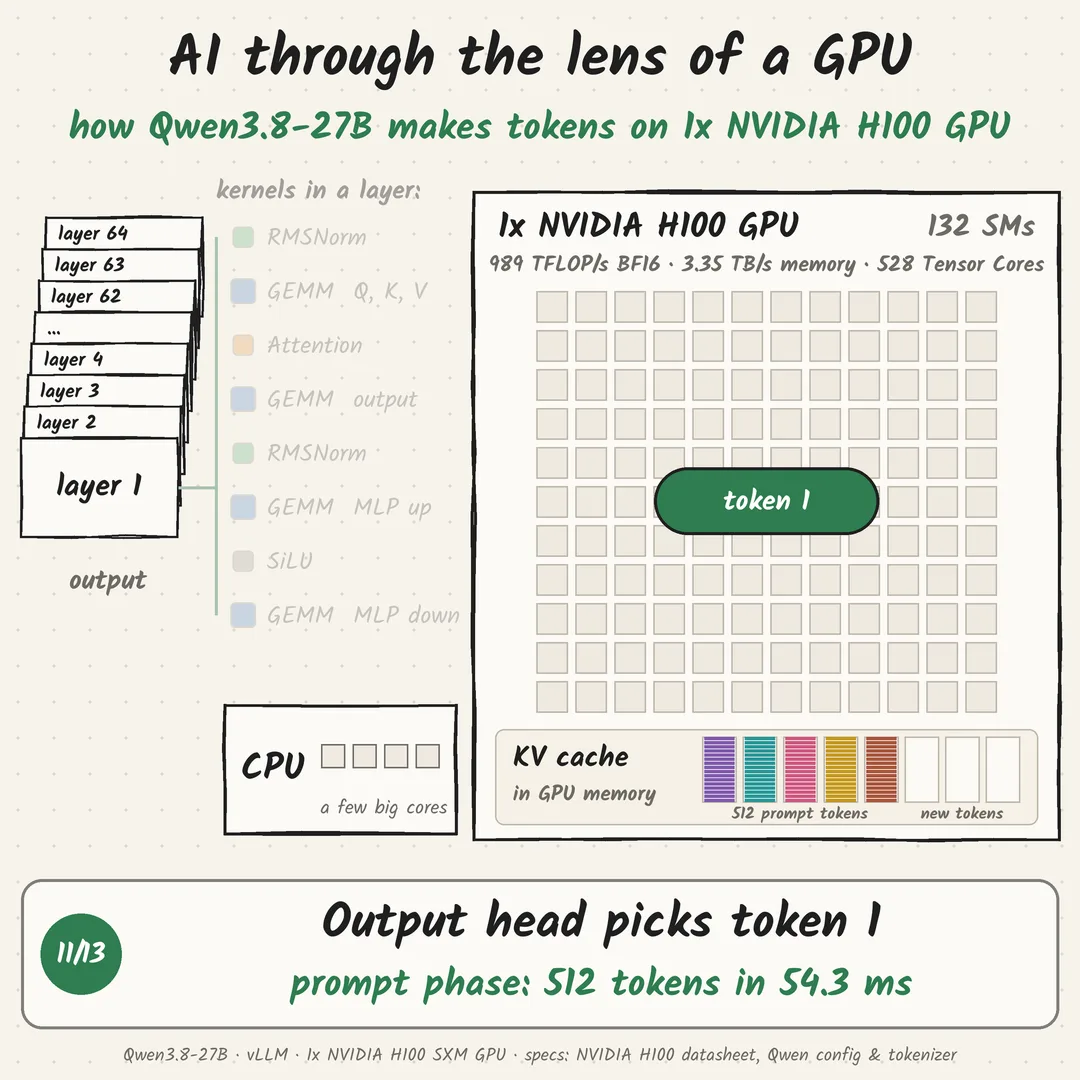
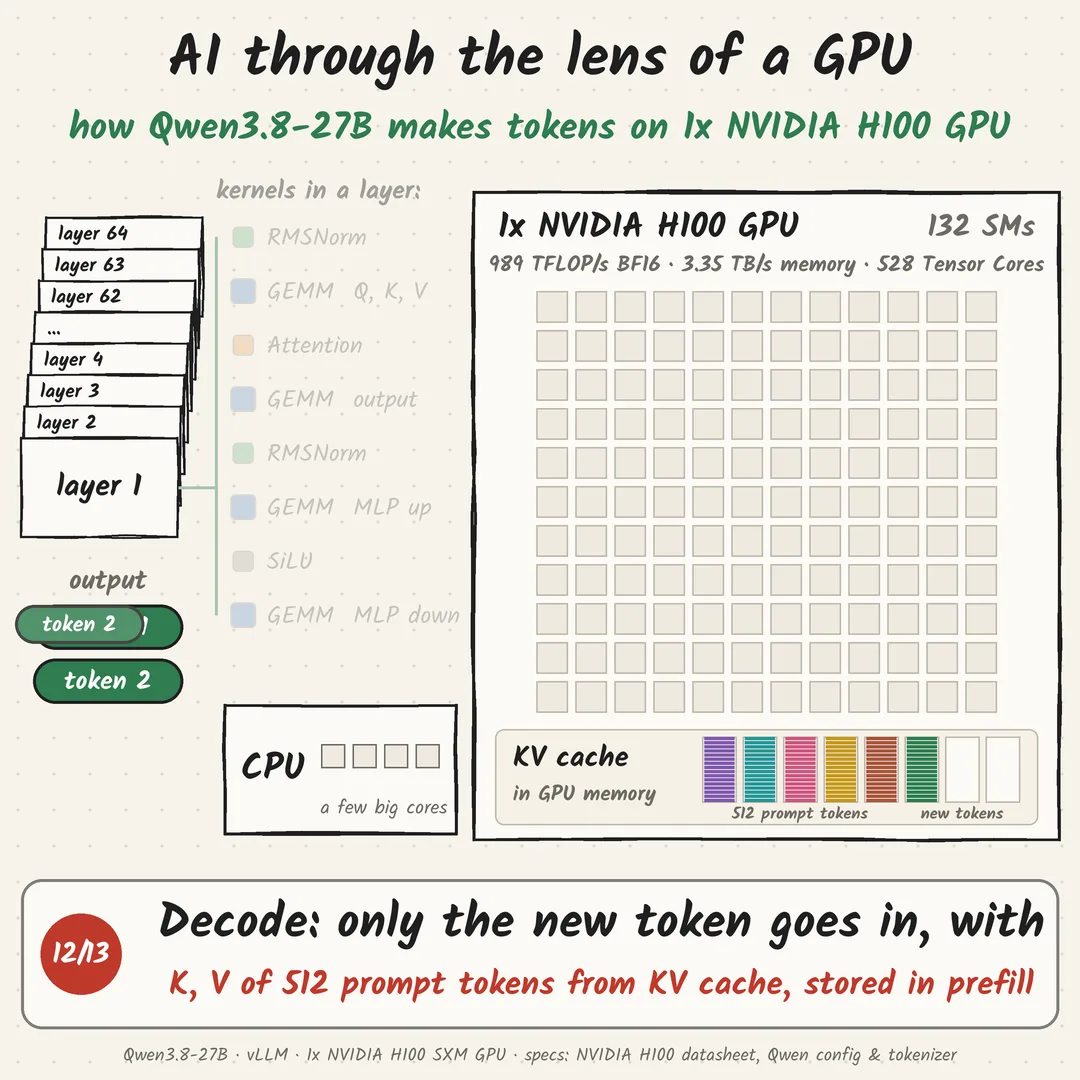
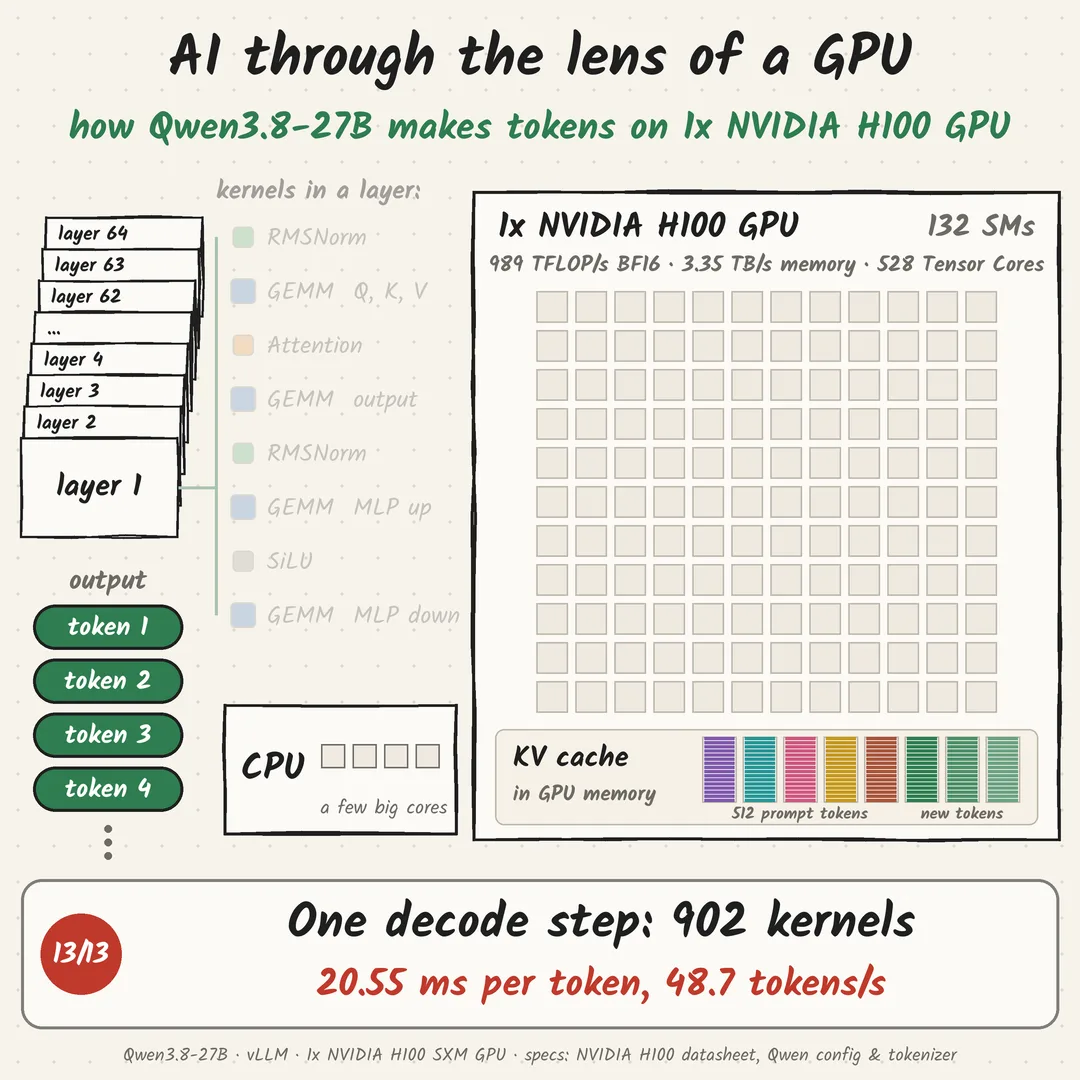
How a prompt becomes an answer:
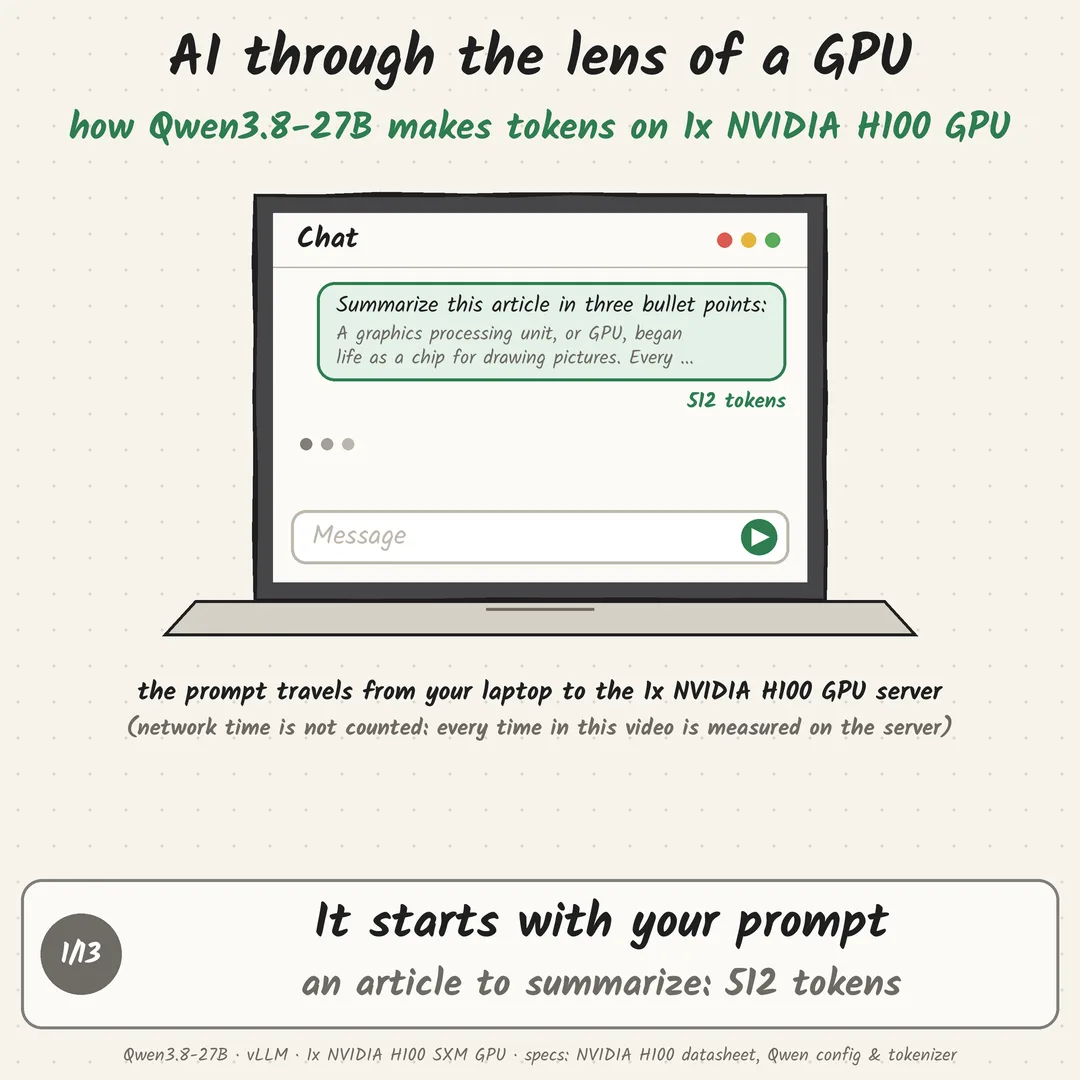
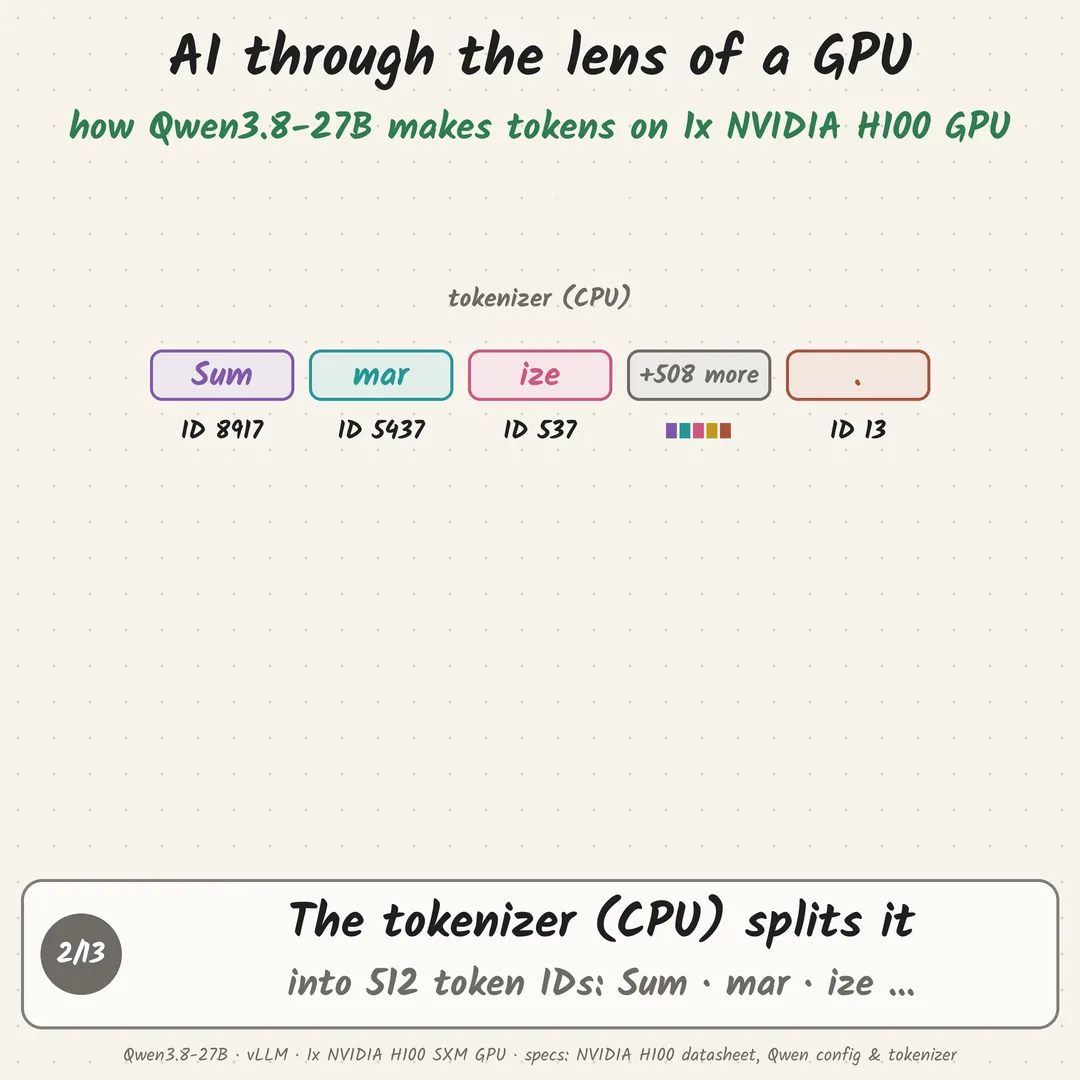
- Tokenizer (on the CPU): my prompt, “Summarize this article…” plus the article, becomes 512 token IDs
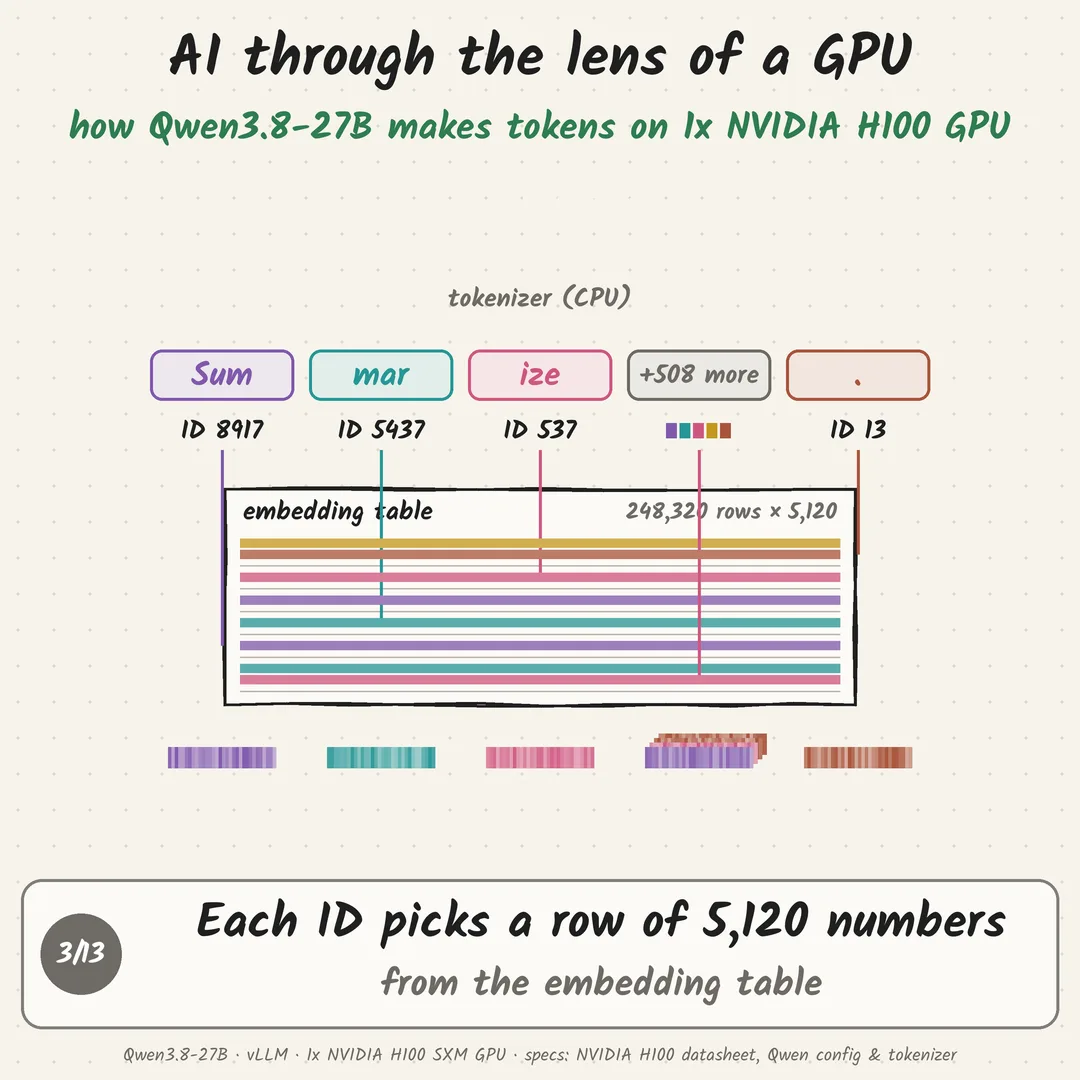
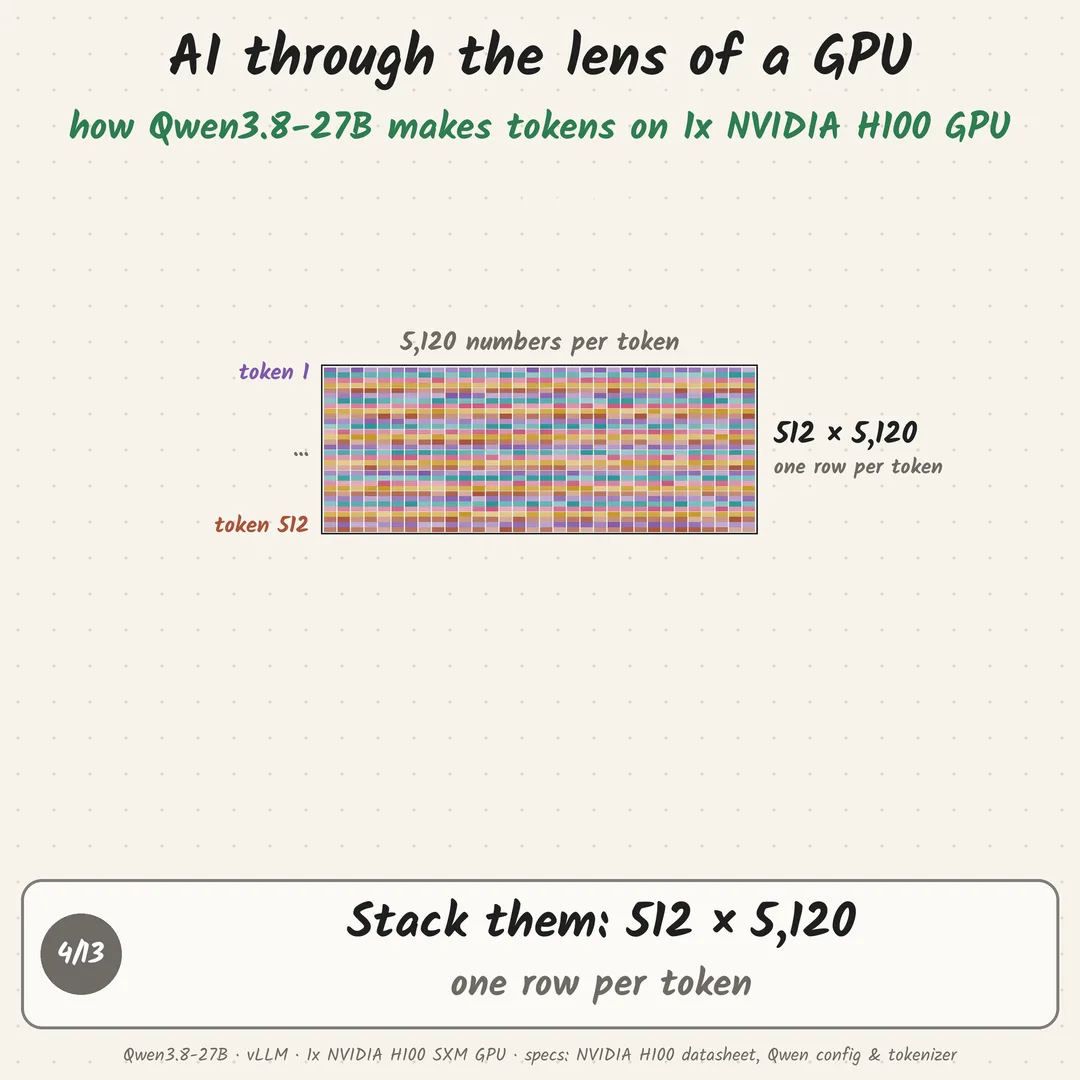
- Embedding: each ID looks up a row of 5,120 numbers, giving a 512 × 5,120 matrix
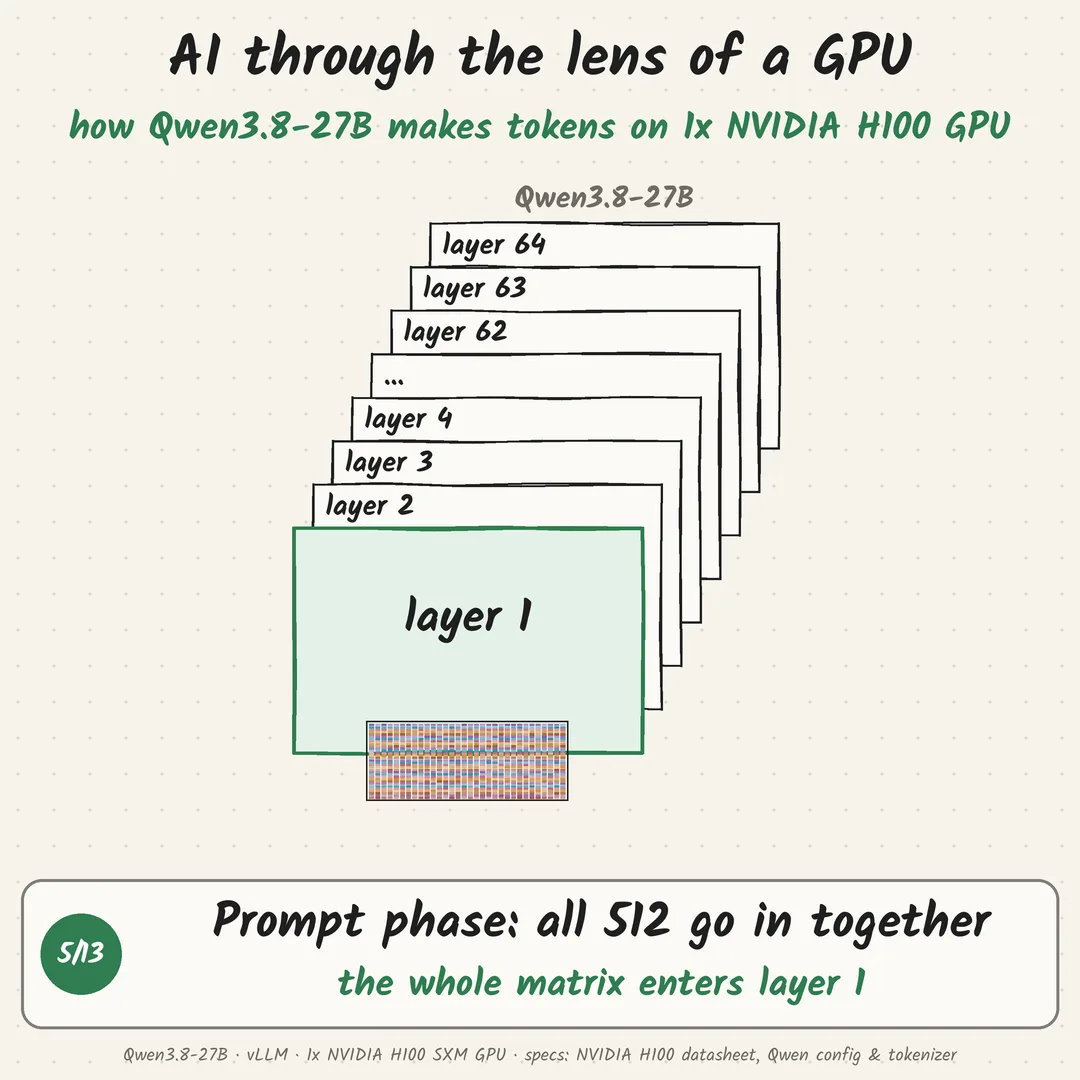
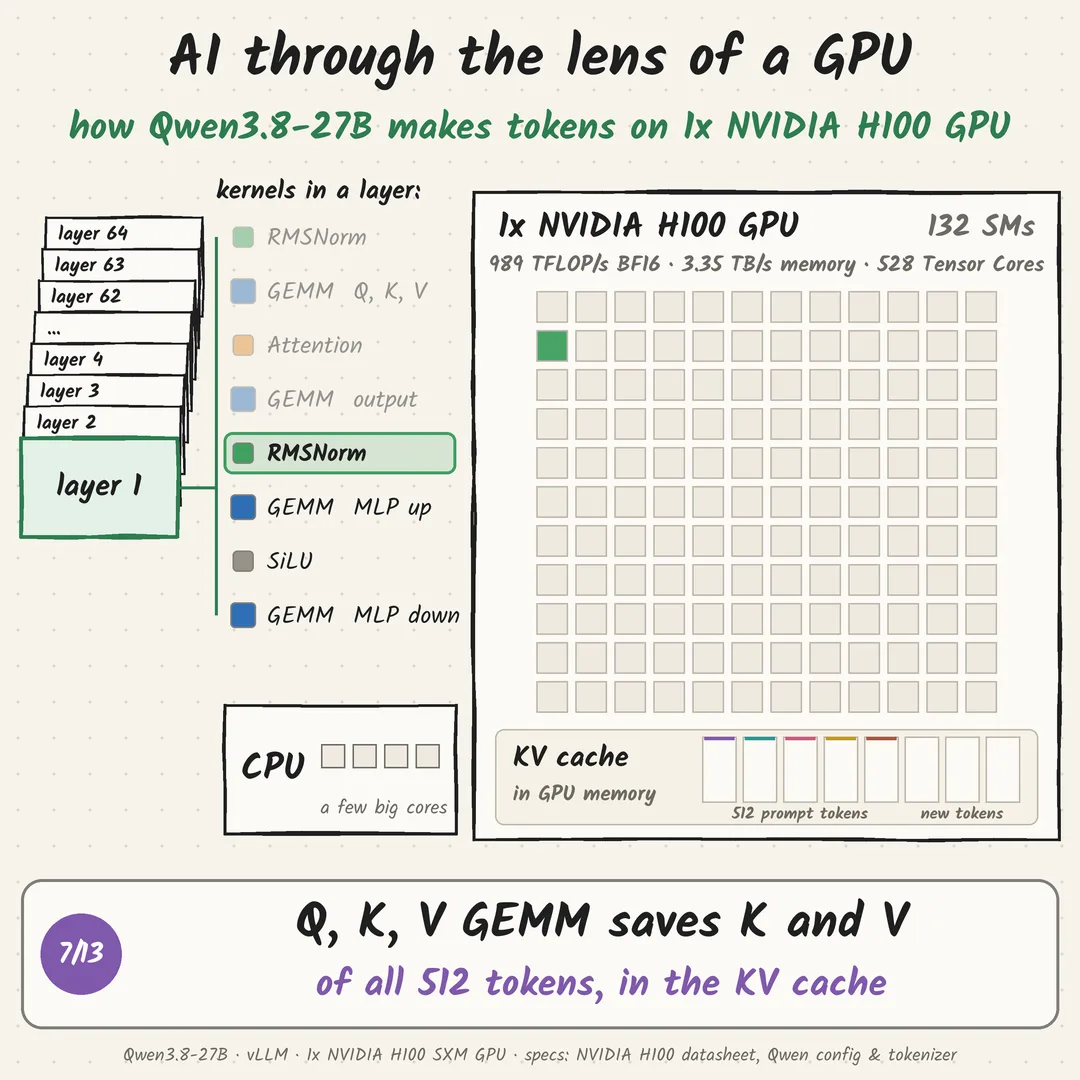
- Prompt phase: the whole matrix of 512 × 5,120 goes through the 64 layers together (54.3 ms on 1x NVIDIA H100 GPU), and each layer saves the K and V of all 512 tokens in the KV cache (GPU memory)
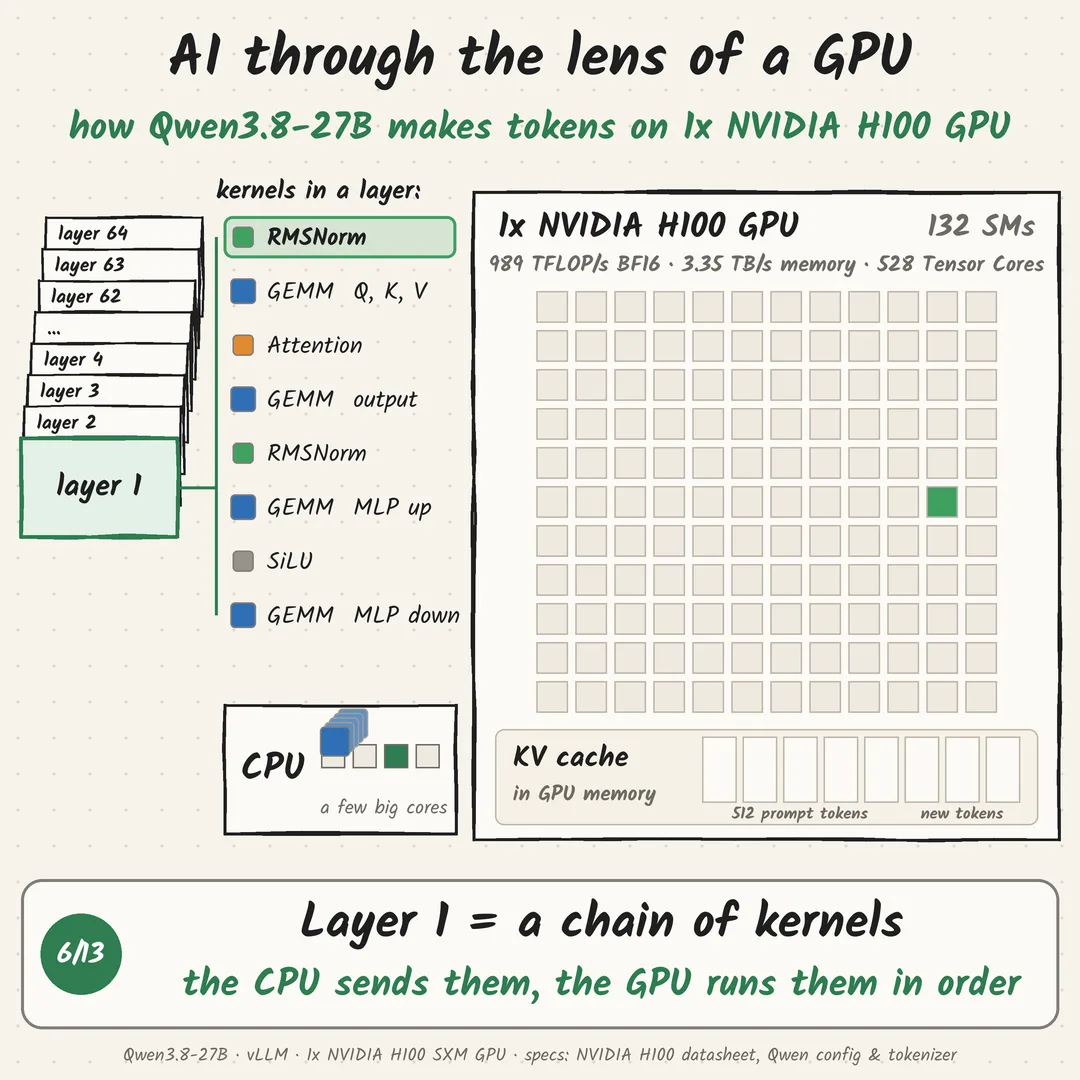
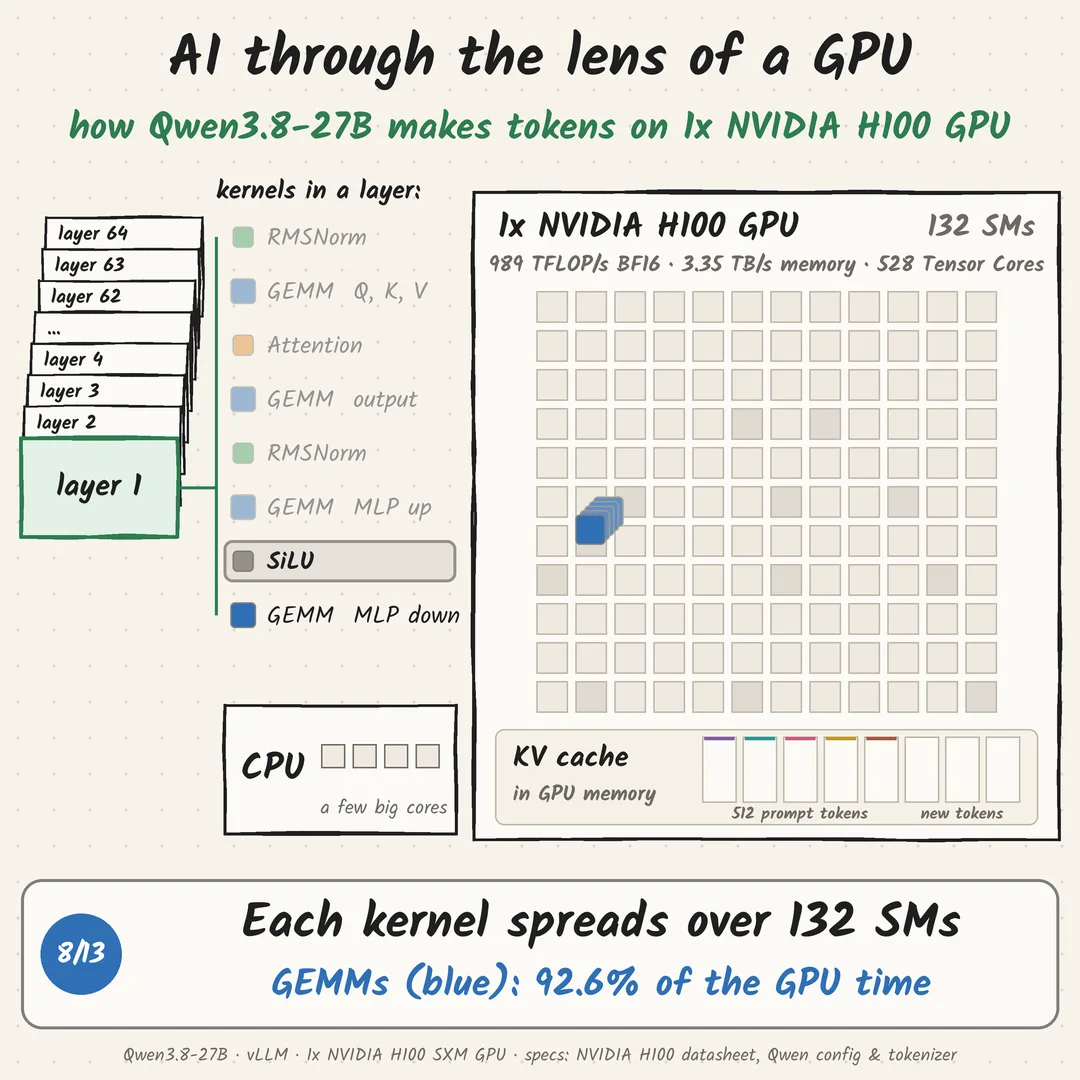
- Each layer is a handful of kernels: RMSNorm, GEMMs, attention, SiLU. The CPU sends them to the GPU, which runs them in order and spreads each one over its SMs
- After layer 64, the output head picks token 1
- Decode phase: the KV cache already holds the K and V of all 512 prompt tokens, so only token 1 goes back in. 64 layers again, out comes token 2. Then token 3…
A 500-token answer = 1 prompt pass + 499 decode passes.
(All times are measured on the GPU server. The network time from your laptop to the server isn’t included.)
One decode step on 1x NVIDIA H100 GPU (batch 1, vLLM default settings):
- 902 kernels in 20.55 ms, 48.7 tokens/s
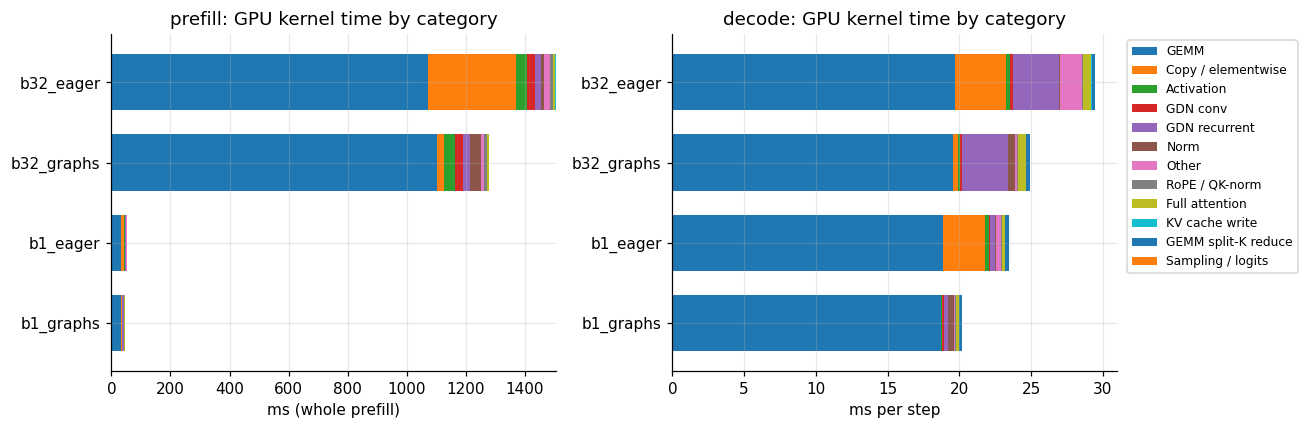
- 305 are GEMMs (matrix multiplies), 92.6% of the GPU time
- the other 597 are small: RMSNorm, attention, SiLU, RoPE, KV-cache writes
Without CUDA graphs (eager mode), the same step is 2,464 kernels, because torch.compile’s fused kernels are off.
The hardware (NVIDIA spec, 1x NVIDIA H100 SXM GPU): 132 SMs · 528 Tensor Cores · 989 TFLOP/s BF16 · 3.35 TB/s memory.
An LLM is mostly matrix multiplies. A GPU is a machine built to run them in parallel.
Next post: prompt phase vs decode phase. Same kernels, very different use of those 989 TFLOP/s.
Which kernel would you guess is the slowest?
Go deeper
The 902 kernels, grouped by what they do. This is the chart behind “92.6% GEMMs”, from the same run’s Nsight Systems traces.

Measured on
- GPU
- 1x NVIDIA H100 SXM 80GB (GCP a3-highgpu-1g)
- Model
- Qwen3.8-27B, BF16
- Engine
- vLLM 0.31, default settings
- Workload
- Batch 1, 512-token prompt
Reproduce it
The notebook for this episode is on its way. Until then, every number traces to the run’s analysis files listed in the sources below.
Sources & methodology
Where every number in this episode comes from: my own runs, the model’s config, or NVIDIA’s datasheet.
- Prompt: 512 tokens, the input length of all my Sillybench runs (
vllm bench latency --input-len 512). The animation’s prompt (prompt/article.txt: “Summarize this article in three bullet points:” + a short article about GPUs) was written to be exactly 512 tokens with the Qwen3.8-27B tokenizer (tokenizer.json from Hugging Face); its IDs are in prompt/prompt_ids.json and start [8917, 5437, 537, …] = ‘Sum’, ‘mar’, ‘ize’ and end with 13 = ‘.’. The benchmark itself fed 512 random token IDs; the time doesn’t depend on which tokens they are. Raw text, no chat template (a chat app adds a few special tokens around it). - Prompt phase time: 54.3 ms for 512 tokens,
vllm bench latency --input-len 512 --output-len 1, batch 1. - Network latency is ignored:
vllm bench latencyruns the engine in-process on the GPU server (no HTTP, no network), so none of the times include the laptop-to-server round trip, tokenization in a separate API server, or queueing. - Model structure: Qwen3.8-27B config.json (num_hidden_layers = 64, vocab_size = 248,320, hidden_size = 5,120).
- H100 SXM5 80GB: NVIDIA H100 datasheet (132 SMs, 528 Tensor Cores, 989 TFLOP/s dense BF16, 3.35 TB/s HBM3). GCP a3-highgpu-1g is the SXM version.
- Kernel counts and GPU-time shares are from my own vLLM 0.31 run with default settings (CUDA graphs on), decode step at batch 1, BF16, Nsight Systems: Sillybench run
2026-10-09_qwen3.8-27b_bf16_initial, analysis/C2_kernels_decode_b1_graphs.csv and C1_phase_summary.csv (kernels_per_step = 902): 305 GEMMs = 92.6% of GPU time (+112 split-K reduce kernels, 1.0%); the other 597 are norms (177), split-K reduce (112), linear-attention recurrence + conv (96), activations (64), full attention (32), RoPE/QK-norm (17), KV-cache writes (16), sampling (5) and others. Not published numbers. Without CUDA graphs (eager) the same step is 2,464 kernels, because torch.compile’s fused kernels are off (later post). - Decode time: 20.55 ms per token from
vllm bench latency(batch 1, 512-token prompt, (out128 - out1) / 127); Nsight Systems median step 20.68 ms. 1 / 20.55 ms = 48.7 tokens/s. - The output head (LM head) is a GEMM over all 248,320 vocab entries; it’s the largest single kernel per step (0.88 ms in the same run).
- The animation shows a simplified, generic layer (8 main kernels); the real step averages ~14 kernels per layer (902 / 64). Which SMs light up per kernel is illustrative.
- The animation shows the CPU sending kernels one by one. With CUDA graphs, vLLM records a decode step once and the CPU launches it with ~21 launch calls per step; the GPU still runs the 902 kernels one after another (later post).
- KV cache in the animation is drawn generically (one row band per layer, one column per token). In Qwen3.8-27B only the 16 full-attention layers keep a growing KV cache; the 48 linear-attention (Gated DeltaNet) layers keep a fixed-size state instead. Left for a later post.
Get the next episode
One email when a new episode is out, plus one figure that doesn’t fit on LinkedIn. No spam.